Data plotting
September 20, 2009by Lee Spector (lspector)
There was a question in class about drawing in DrScheme, and another over email about doing things with numerical data in the form of (x y) pairs. Both of these are big subjects to which we can devote more attention in the future, but I thought some of you might be interested in one fairly simple intersection of these subjects: drawing simple plots of (x y) pair data in DrScheme.
The following is code that you can use to make such plots. It uses a couple of slightly fancy things that we haven’t yet covered — keyword arguments, “map”, etc. — and I won’t explain those here, but we can go over them in class:
(require plot)
(define plot-points
  (lambda (list-of-xy-pairs)
    (plot (points (map (lambda (p) (apply vector p)) list-of-xy-pairs)
                  #:sym 'oplus)
          #:x-min (apply min (map first list-of-xy-pairs))
          #:x-max (apply max (map first list-of-xy-pairs))
          #:y-min (apply min (map second list-of-xy-pairs))
          #:y-max (apply max (map second list-of-xy-pairs)))))
The first line, (require plot), gives you access to all of the things in the “plot” module — you’ll see things like this whenever we use libraries that aren’t part of the core Scheme language.
The plot-points function expects to be called with a single argument, which should be a list of (x y) pairs, where each (x y) pair is a list of two numbers.
So for example after you evaluate the definition above you could do something like:
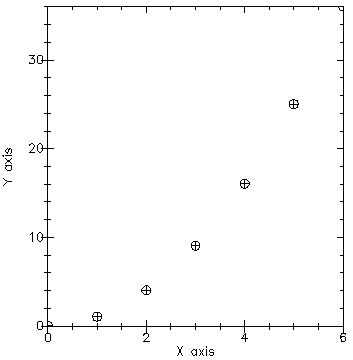
(plot-points '((0 0) (1 1) (2 4) (3 9) (4 16) (5 25) (6 36)))
to produce:
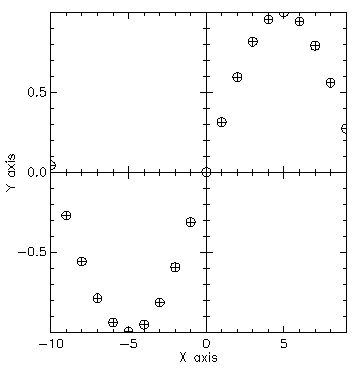
Here’s something a little fancier, in which I generate the data using a for/list loop (which we haven’t yet covered in class):
(plot-points (for/list ((x (in-range -10 10)))
               (list x (sin (/ x 3.14)))))
This produces:
The plot package can be used for many other kinds of plots, and there are additional libraries for different kinds of graphics, but this might be useful for some simple data plotting applications.
-Lee